
Most finance teams do not have an AI problem. They have a planning-model problem.
The budget workbook has 37 tabs. Three of them are hidden. One has a broken lookup nobody wants to touch. The department mapping lives in a separate file. Headcount is linked to a version from last month. Actuals are pasted in manually. The board plan, working plan, stretch plan, and “final final” plan all exist, but nobody is completely sure which one is the source of truth.
Then someone asks, “Can we use AI on this?” Maybe. But not yet.
AI can help finance teams move faster, explain variances, summarize forecast changes, pressure-test assumptions, and draft board-ready commentary. But AI cannot magically fix a messy planning model. If the structure is unclear, the definitions are inconsistent, and the numbers do not tie, AI will just help you generate confident-sounding commentary on top of a weak foundation.
The goal is not to make your Excel model prettier. The goal is to make it ready for automation, analysis, and AI-assisted planning.
What AI-Ready Actually Means
An AI-ready planning model is not a workbook with cleaner formatting. It has a structure that a system, an analyst, or an AI assistant can read and use reliably. Clear dimensions. Consistent definitions. Separated inputs and formulas. Traceable source data. Repeatable calculations. Governance around versions.
In plain English, an AI-ready planning model answers these questions without a scavenger hunt:
If your workbook cannot answer those, it is not ready for AI. It is ready for cleanup.
Start with the Biggest Lie in the Workbook
Every messy budget model has one big lie.
The department hierarchy is basically right. The headcount tab mostly ties to HR. The revenue assumptions are in the latest file. The model is driver-based because someone added a few inputs at the top of a tab.
Find the lie first. The fastest way to improve a planning model is to identify the thing everyone works around and nobody fixes. That is where automation will break.
Common examples:
Before AI analyzes the model, fix the structural lie.
Step One: Define the Planning Grain
The most important planning decision is the grain.
Grain is the level of detail where the model stores data. Without an explicit grain, the workbook will define it accidentally, and every tab will use a different one.
Messy models mix grains. One tab has annual department budgets. Another has monthly vendor detail. Another has employee-level compensation. Another has location-level revenue. The summary page tries to make all of it tie. That is where formulas get weird.
Define the grain for each planning area. Document it. Not every schedule needs the same grain. Every schedule needs a clear one.
Step Two: Standardize the Dimensions
AI-ready planning models need consistent dimensions. Dimensions are the labels that let finance slice, roll up, compare, and explain the business. They are also where messy Excel models quietly fall apart.
Core dimensions:
The key is consistency. Sales Ops cannot use Enterprise while finance uses ENT and the board deck uses Strategic Accounts to mean the same thing. One tab cannot call a location NYC while another calls it New York and a third calls it Manhattan. Department rollups cannot depend on which analyst built the file.
Create mapping tables. Make them boring. Make them explicit. This is unglamorous work. It is also what makes AI useful later.
Step Three: Separate Inputs, Calculations, and Outputs
Messy Excel models mix inputs, formulas, and outputs on the same tab. That is how models become fragile. Someone overwrites a formula with a hardcode. Someone changes an assumption in a summary tab. Someone adds a row that breaks a lookup. Someone drags a formula across a month that should have been static.
An AI-ready model separates the layers:
This structure matters because AI needs to know what changes and what does not. If an assumption changes, the model updates. If a formula changes, finance knows who changed it and why. If an output changes, it traces back to the input, source data, or calculation that caused it.
The practical fix:
Analysts should never have to guess which cells are safe to touch.
Step Four: Turn Line Items into Drivers
Traditional budgets start with line items. Modern planning models start with drivers.
A line-item budget says software expense will be $85K per month. A driver-based model says software expense equals seats multiplied by cost per seat, plus committed contracts, plus planned renewals. A line-item budget says revenue grows 12%. A driver-based model says revenue equals customers, volume, price, conversion, churn, expansion, or utilization.
This matters because AI is far more useful when it can reason about drivers. It can answer:
Driver examples:
Rebuilding the whole budget at once is not the answer. Pick the planning areas where leadership asks the most what-if questions. Those become driver-based first.
Step Five: Build A Real Actuals Bridge
Most budget models fail when actuals arrive. The plan was built one way. Actuals come out of the ERP another way. Someone exports the GL, pastes it into a tab, maps accounts manually, adjusts departments, and tries to make the month tie. That is not an actuals bridge. That is a monthly ritual.
An AI-ready model loads actuals at a usable grain and maps them into the same dimensions as the plan.
At minimum, define:
This is where finance teams discover the model is disconnected from reality. The budget looks clean. The actuals will not load into the same structure. Reporting will always require manual reconciliation. AI explains variances only when actuals and plan data are comparable.
Step Six: Control Versions and Scenarios
If your scenarios are separate workbooks, your model is not AI-ready. It is ungoverned. Assumptions drift. Formulas diverge. Leaders compare numbers built from different logic.
Scenarios are a dimension, not a file name.
Each scenario uses the same structure with clearly controlled assumptions. Finance compares scenarios side by side and explains what changed. The goal is not to prevent scenario planning. The goal is to make scenario planning safe.
Step Seven: Add Checks Before You Add AI
Before AI goes on top of a planning model, controls go in.
Basic checks:
Checks are not optional. Checks are what let finance trust automation. Raw LLMs are probabilistic. They produce different answers across runs. They get calculations wrong when they are not grounded in deterministic financial logic. The planning model needs SaaS-quality controls before AI becomes useful.
The AI layer is flexible. The financial model is not.
Step Eight: Build the Narrative Layer
Once the model structure is clean, AI becomes useful. It helps finance:
The narrative layer ties to the model.
Bad AI prompt: Write a summary of this budget.
Better AI prompt: Using the attached budget data, summarize the top five changes versus the prior forecast. For each change, include the account, department, dollar impact, percent impact, driver, whether it is recurring or timing-related, and recommended follow-up.
Best system: The model already knows the account, department, variance, driver, threshold, owner, and scenario. AI drafts the explanation from governed data. Finance reviews and edits.
That is the difference between AI as a writing assistant and AI inside the planning workflow.
Before and After
Before
After
That is what AI-ready means. Not perfect. Structured enough to trust.
A Practical 30-day Cleanup Plan
A year-long transformation is not required. Thirty days will move the model.
Week one: inventory the mess. List every workbook, tab, source file, owner, and downstream report. Identify the core planning areas: revenue, headcount, opex, CapEx, balance sheet, cash flow, reporting. Mark each area green, yellow, or red. Green means structured and trusted. Yellow means usable but manual. Red means fragile, unclear, or dependent on one person. Start with the biggest red area that touches executive reporting.
Week two: standardize dimensions. Clean the chart of accounts, departments, entities, locations, products, customers, and scenarios. Build mapping tables. Remove duplicate labels. Define the official hierarchy. The most boring week. The most important week.
Week three: separate inputs and logic. Move assumptions into input tables. Protect formulas. Remove hardcodes from calculation areas. Build checks that show whether the model ties. The test: someone who did not build the model can understand it.
Week four: connect narrative to the model. Pick one reporting workflow. Variance commentary is the right place to start. Define the materiality threshold, comparison period, driver categories, owner field, and commentary structure. Use AI to draft explanations from the governed data. Do not automate everything. Automate one workflow well.
Prompts to Help Clean the Model
AI accelerates cleanup as long as it is not the source of truth for calculations.
Model audit prompt: Review this workbook structure and identify signs that the planning model is not scalable. Look for mixed inputs and formulas, unclear dimensions, hardcoded assumptions, duplicated logic, missing checks, hidden dependencies, and version-control risks. Return a prioritized cleanup list.
Dimension cleanup prompt: Given this list of departments, identify duplicates, inconsistent naming conventions, unclear rollups, and labels that should be standardized. Suggest a clean department hierarchy for FP&A reporting.
Driver design prompt: For this budget line item, suggest the operational drivers that should determine the forecast. Include possible source systems, business owners, update cadence, and how the driver would flow into the P&L.
Variance commentary prompt: Using this actual vs. forecast data, draft CFO-quality commentary for material variances. For each item, include what moved, how much it moved, likely driver, whether it appears timing-related or recurring, forecast impact, and recommended follow-up.
Board summary prompt: Summarize the budget changes for an executive audience. Focus on what changed versus the prior forecast, why it changed, what it means for margin and cash, and what decisions leadership needs to make.
Use AI for structure, review, narrative, and pattern recognition. Do not use a raw LLM as the calculation engine.
Where Una Fits
Una's point of view: finance teams need both AI automation and deterministic financial intelligence.
Raw LLMs are probabilistic. They write, summarize, brainstorm, and explain. They also produce different answers across runs and unreliable calculations when they are not grounded in governed data and repeatable logic. Finance needs the magic of AI and the stability of SaaS-quality planning infrastructure.
That means:
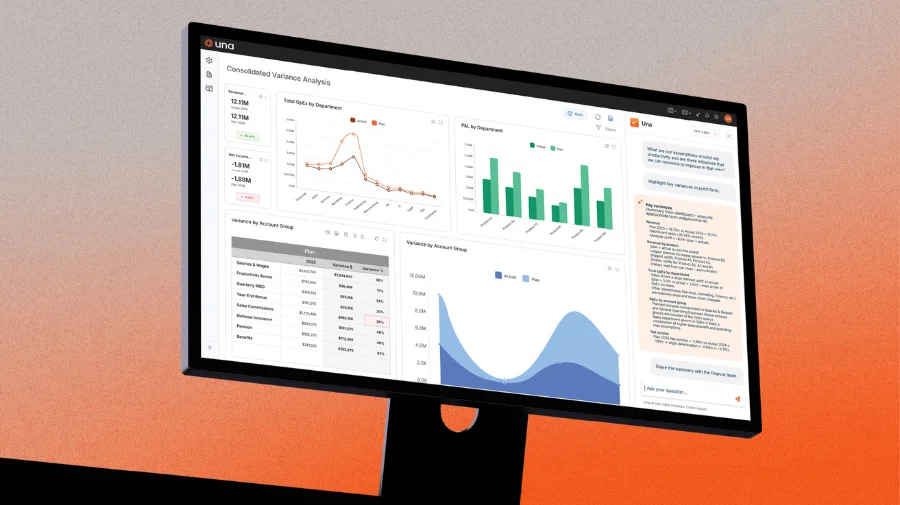
Una's Budgeting & Forecasting solution is built exactly this way: a governed planning model where dimensions, drivers, scenarios, and actuals share one structure, and AI generates commentary and analysis on top of deterministic logic finance controls.
The difference is real. Asking AI to summarize a messy spreadsheet produces a better paragraph. Running AI inside an AI-ready planning model produces a better finance process.
Final Takeaway
A messy budget workbook will not be fixed by AI. AI makes the mess more convincing.
The path is structured, governed, and explainable first. Define the grain. Standardize the dimensions. Separate inputs from logic. Connect actuals. Control scenarios. Add checks. Then use AI to accelerate the work finance should not have to do manually.
An AI-ready planning model does not eliminate finance judgment. It gives finance more time to use it. See how much more time your finance team will have with Una.
Ready to take control of your budgeting, planning, forecasting and reporting? Schedule a demo and see how Una’s financial planning & analysis software can work for you.
Schedule Demo


