Most finance teams do analysis after the numbers are already broken. The better operating model is to use data before the meeting: describe what happened, diagnose why it happened, predict what might happen next, and prescribe what action leadership should take.
Most finance teams are not short on data. They are short on timing.
They wait until the month-end pack is done, the variance is embarrassing, the forecast is off, or the CEO asks the one question nobody prepared for. Then everyone scrambles to answer the same four questions: what happened, why did it happen, what should we do, and what next.
That workflow is backwards.
If your analysis starts after the meeting, finance is already in defense mode. If your analysis starts before the meeting, finance becomes the team that sees the risk, frames the options, and helps the business choose the next move.
That distinction matters more now because AI is changing the expected speed of FP&A work. The 2025 FP&A Trends Survey found that 53% of FP&A teams still do not use AI in any FP&A process, while the same research reported that teams using AI and machine learning rated their forecasts as great or good 65% of the time, compared with 42% for the average organization.1 The advantage is not that AI magically knows your business. The advantage is that disciplined teams can move from reporting to decision support much faster.
The trap is thinking data analysis is one activity.
It is not. Data analysis is a sequence.
You describe what happened. You diagnose why it happened. You predict what could happen next. You prescribe what to do about it.
When finance teams skip that sequence, they produce dashboards without decisions, commentary without confidence, and forecasts without action.
The problem: finance usually enters the conversation too late
Here is a common FP&A pattern.
The business misses gross margin by 220 basis points. Sales says discounting defended volume. Operations says freight and overtime were the issue. Product says mix shifted toward lower-margin SKUs. The CFO asks for a bridge by tomorrow morning.
At that point, finance is reconstructing the crime scene.
The team pulls the P&L, checks revenue, checks COGS, slices by product, asks sales ops for pipeline context, asks operations for production schedules, exports three spreadsheets, refreshes the model, creates a variance bridge, writes the commentary, and hopes the answer is both accurate and politically survivable.
That is the late-analysis problem.
It creates three bad outcomes.
First, the analysis becomes reactive. You are explaining the miss after the choices that caused the miss have already compounded.
Second, the business learns to treat finance as a reporting function instead of a decision partner. You become the team that validates what happened, not the team that helps shape what happens next.
Third, the conversation becomes emotional because there is no shared fact base. When the operating team sees a number for the first time in a monthly meeting, the debate shifts from decisions to defensiveness.
This is why the best finance teams are not simply faster at reporting. They are better at staging the right type of analysis at the right moment.
The shift: from hindsight reporting to foresight planning
Traditional FP&A was built around calendar cycles: month-end close, board pack, forecast refresh, budget season, and quarterly business review. Modern FP&A is moving toward continuous Performance Planning, where changes in revenue, pipeline, churn, headcount, pricing, cost, and cash become decision-ready insight before leadership is forced to react.
This is where AI becomes useful, but only if you understand where it belongs. AI should not replace finance judgment. It should compress the mechanical work around analysis: summarizing variance drivers, testing scenarios, drafting executive narratives, finding anomalies, generating first-pass bridges, and turning messy operational inputs into a structured decision frame.
IBM describes the shift in FP&A as moving beyond historical analysis toward automation, enhanced forecasting, and real-time strategic decision-making.2 Oracle makes a similar point, arguing that AI-driven FP&A helps teams move from hindsight to foresight through predictive analytics, root-cause analysis, and recommended actions.3
The practical takeaway is simple: AI is most valuable when your finance team already knows which analytical question it is trying to answer. That is why the four-type framework matters.
The framework: the 4 types of data analysis finance teams need
There are four core types of analysis every finance team should be able to run. Each answers a different leadership question, requires a different output, and becomes more valuable when used in sequence.
Analysis typeLeadership questionFinance outputBest moment to use itDescriptiveWhat happened?Performance summary, KPI pack, financial statement viewBefore the meeting startsDiagnosticWhy did it happen?Variance bridge, root-cause analysis, driver explanationAs soon as the number movesPredictiveWhat might happen next?Forecast, scenario model, sensitivity tableBefore decisions are lockedPrescriptiveWhat should we do?Ranked action plan, tradeoff analysis, recommendationWhen leadership needs a decision
1. Descriptive analysis: what happened?
Descriptive analysis is the foundation. It tells you what happened in the business.
This includes actual financial statements, KPI reporting, revenue trends, headcount reporting, customer metrics, churn reporting, monthly performance summaries, and board-level management reporting. It is the part of analysis most finance teams already know how to do.
But descriptive analysis is often misunderstood.
The goal is not to dump numbers into a deck. The goal is a clear, trusted, executive-ready picture of performance.
A strong descriptive output answers questions like these:
1.What was actual revenue, gross margin, EBITDA, cash, and headcount?
2.How did performance compare to budget, forecast, prior month, and prior year?
3.Which KPIs moved enough to deserve leadership attention?
4.Where did performance improve, deteriorate, or remain stable?
5.What is the cleanest one-page view of the business right now?
AI can help by summarizing large reporting packs, drafting plain-English commentary, identifying unusual movements, and turning raw tables into executive narratives. But the finance team still needs to own the definitions, the source of truth, and the judgment about materiality.
A useful AI prompt for descriptive analysis might be:
You are a senior FP&A analyst. Your goal is to describe Q3 performance for a manufacturing company. Use monthly P&L data, units, ASP, gross margin, operating expenses, cash movement, and prior-year comparatives. Return a table with totals and month-over-month and year-over-year deltas, followed by five executive bullets covering revenue, cost, margin, cash, and operational risk. Write in plain English for a board audience.
That prompt works because it defines the role, objective, data inputs, output format, and audience.
2. Diagnostic analysis: why did it happen?
Diagnostic analysis explains why the number changed.
This is where finance earns credibility with the business. Anyone can say gross margin fell. A strategic finance team can show whether the decline came from price, volume, mix, input costs, freight, FX, labor efficiency, scrap, overtime, customer concentration, channel mix, or one-time items.
This is the work behind margin decline analysis, price-volume-mix analysis, cost variance review, root-cause analysis, cohort analysis, and 80/20 driver analysis.
The simplest rule is this: do not stop at the first explanation.
If revenue missed because volume fell, ask which product, which region, which customer segment, which channel, and which sales motion drove the decline. If opex increased because contractor spend rose, ask which department, which project, which approval path, and whether the work was temporary or structural.
Diagnostic analysis should produce a driver tree, not a paragraph of excuses.
A useful AI prompt might be:
You are a financial controller. Your goal is to explain why gross margin fell by 220 basis points in August. Use July through September P&L by product, price-volume-mix data, freight, FX, scrap, overtime, and one-time costs. Return a variance bridge split by price, volume, mix, material cost, freight, labor, FX, and one-offs, plus three short paragraphs on drivers, root causes, and immediate mitigations. Quantify each driver.
Notice the discipline. The prompt does not ask for a vague explanation. It asks for a quantified bridge and a decision-ready narrative.
3. Predictive analysis: what might happen next?
Predictive analysis estimates what could happen next.
This includes revenue forecasts, cash flow forecasts, production output forecasts, scenario planning, sensitivity analysis, churn projections, bookings forecasts, and capacity planning. It is where finance moves from describing the current state to preparing the business for possible future states.
This is also where many teams overcomplicate the work.
A useful forecast does not need to be perfect. It needs to be clear about the base case, upside case, downside case, assumptions that matter, and decision thresholds leadership should watch.
AI can help test sensitivity ranges, summarize forecast movements, generate scenario narratives, and identify assumptions that deserve challenge. But it should not be treated as a black box. Every forecast needs explainable assumptions.
A useful AI prompt might be:
You are a CFO. Your goal is to forecast next-quarter revenue and gross margin with sensitivities. Use the last 12 months of actuals by product, current pipeline, seasonality index, capacity constraints, backlog, pricing assumptions, and current FX rates. Return base, low, and high tables, plus a sensitivity grid for plus or minus 5% price, plus or minus 10% volume, and plus or minus 3% FX showing impact on gross margin percentage and EBITDA. State the forecasting method in 40 words.
The output gives leadership a range, not a false sense of certainty.
4. Prescriptive analysis: what should we do?
Prescriptive analysis recommends action.
This is the most valuable and least consistently practiced type of finance analysis. It combines diagnostic insight and predictive modeling to identify the best next step.
Prescriptive analysis answers questions like these:
1.Which margin levers should we pull first?
2.Which cost reductions create the least strategic damage?
3.Which customers, products, or channels deserve more investment?
4.Should we raise price, reduce discounting, change packaging, adjust hiring, or reallocate resources?
5.Which option has the best expected return after considering risk, timing, and execution difficulty?
The key is that prescriptive analysis must include tradeoffs.
A recommendation without tradeoffs is just an opinion. A recommendation with expected financial impact, confidence level, implementation owner, timing, risks, and dependencies is a finance-led decision framework.
A useful AI prompt might be:
You are a finance strategy advisor. Your goal is to recommend actions to reach a 35% gross-margin target next quarter. Use the diagnostic variance bridge, predictive forecast outputs, cost drivers, customer profitability, pricing levers, capacity constraints, and available commercial actions. Return a ranked action list with expected basis-point impact, implementation owner, timing, confidence level, and execution risk. Prioritize the top five actions and keep the executive summary to 120 words.
This is where finance becomes strategic. Not because it has more charts, but because it can translate analysis into a decision.
Real-world application: how the sequence works in a monthly business review
Imagine a company enters the monthly business review with revenue 4% above forecast but gross margin 180 basis points below plan.
A reactive finance team presents the P&L and says revenue beat, margin missed, and more analysis is needed.
A strategic finance team walks in with the sequence already completed.
The descriptive view shows that revenue beat forecast by $1.2 million, gross margin missed by 180 basis points, and EBITDA was flat because higher revenue offset margin pressure. The team highlights three movements that matter: enterprise volume increased, discounting increased, and freight costs spiked in two regions.
The diagnostic view shows that 70 basis points of margin pressure came from discounting, 45 basis points came from product mix, 35 basis points came from freight, and 30 basis points came from overtime. The team does not argue in generalities. It quantifies the bridge.
The predictive view shows that if the same mix and discounting continue, next-quarter gross margin lands at 32.8% versus a 35.0% target. The downside case falls to 31.9% if freight stays elevated and sales pulls more discounting to hit volume targets. The upside case reaches 35.4% if discount guardrails are enforced and production overtime normalizes.
The prescriptive view recommends five actions: tighten discount approval above 12%, shift two campaigns toward higher-margin SKUs, renegotiate regional freight lanes, add a temporary production planning review, and pause one low-margin custom configuration. Each action has an owner, impact, risk, and timing.
That is a different meeting. The CFO is no longer asking finance what happened. The CFO is asking the business which action it will commit to.
What to do next: build the analysis cadence before the next problem
If you want to make this practical, do not start by buying another dashboard. Start by redesigning the cadence.
1.Define the four questions for every major review. For each leadership meeting, decide in advance how you will answer what happened, why it happened, what might happen next, and what action is recommended.
2. Map each question to a required output. Descriptive analysis should produce a performance summary. Diagnostic analysis should produce a driver bridge. Predictive analysis should produce scenarios and sensitivities. Prescriptive analysis should produce ranked actions.
3.Create a Single Source of Truth for the core drivers. You cannot run strategic analysis if revenue, headcount, pipeline, churn, cost, and cash live in disconnected files with conflicting definitions.
4.Use AI where it compresses time, not where it replaces accountability. AI is excellent for first drafts, summarization, pattern detection, scenario framing, and narrative generation. It is not accountable for the recommendation. Finance is.
5.Move analysis upstream. Do not wait for month-end to diagnose drivers. Set thresholds that trigger review when margin, pipeline coverage, hiring, cash, or churn moves outside tolerance.
6.Bring actions, not just observations. Every major variance should end with an owner, an action, an expected financial impact, and a date for follow-up.
7.Close the loop. In the next meeting, review whether the action worked. If it did not, update the assumptions. That feedback loop is how finance teams improve forecast accuracy and decision quality over time.
Tools can help, especially when planning data, revenue intelligence, embedded BI, and action tracking are connected in one workflow. Some teams use modern Performance Planning platforms for this; others start with disciplined spreadsheets, BI dashboards, and structured AI prompts. The tool matters, but the operating model matters more.
The big shift is mental.
Data analysis is not a report you prepare after the business has already missed the number.
It is a sequence that starts before the meeting, before the decision, and ideally before the problem becomes obvious.
Describe what happened. Diagnose why it happened. Predict what could happen next. Prescribe what to do about it.
That is how finance stops being a scoreboard and starts becoming a strategic operating system for the business.
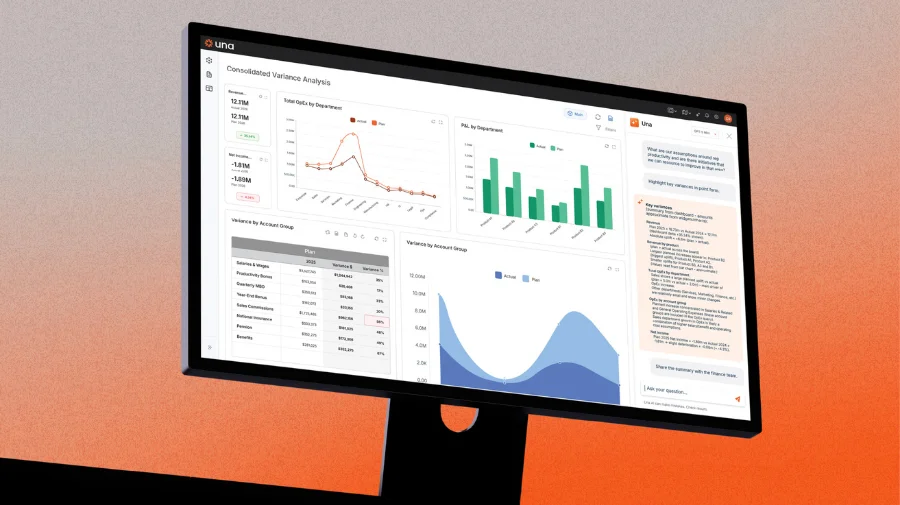
Ready to take control of your budgeting, planning, forecasting and reporting? Schedule a demo and see how Una’s financial planning & analysis software can work for you.
Schedule Demo