
You spend hours in Excel every single week. It is the undisputed operating system of modern finance. But if you are still manually writing complex nested formulas, wrestling with data formatting, or building three-statement models from scratch, you are operating at a massive disadvantage.
The introduction of ChatGPT into the Excel ecosystem has fundamentally changed the nature of financial analysis. Yet, when I talk to finance leaders and FP&A professionals, I see a consistent pattern. They install an AI add-in, use it to write a VLOOKUP or summarize a table, and then they stop. They declare that AI is a neat trick but not a game-changer.
They are wrong. They are simply stopping at Level 1.
To understand the true potential of AI in finance, you have to push past the basic parlor tricks. You have to treat ChatGPT not as a formula generator, but as a junior analyst, a VBA developer, and a quantitative researcher all rolled into one.
I spent the last month mapping out exactly one hundred distinct use cases for ChatGPT inside Excel. I categorized them into three levels of maturity. When you reach Level 3, Excel stops feeling like a spreadsheet and starts feeling like a dynamic, intelligent research platform. Here is the complete blueprint.
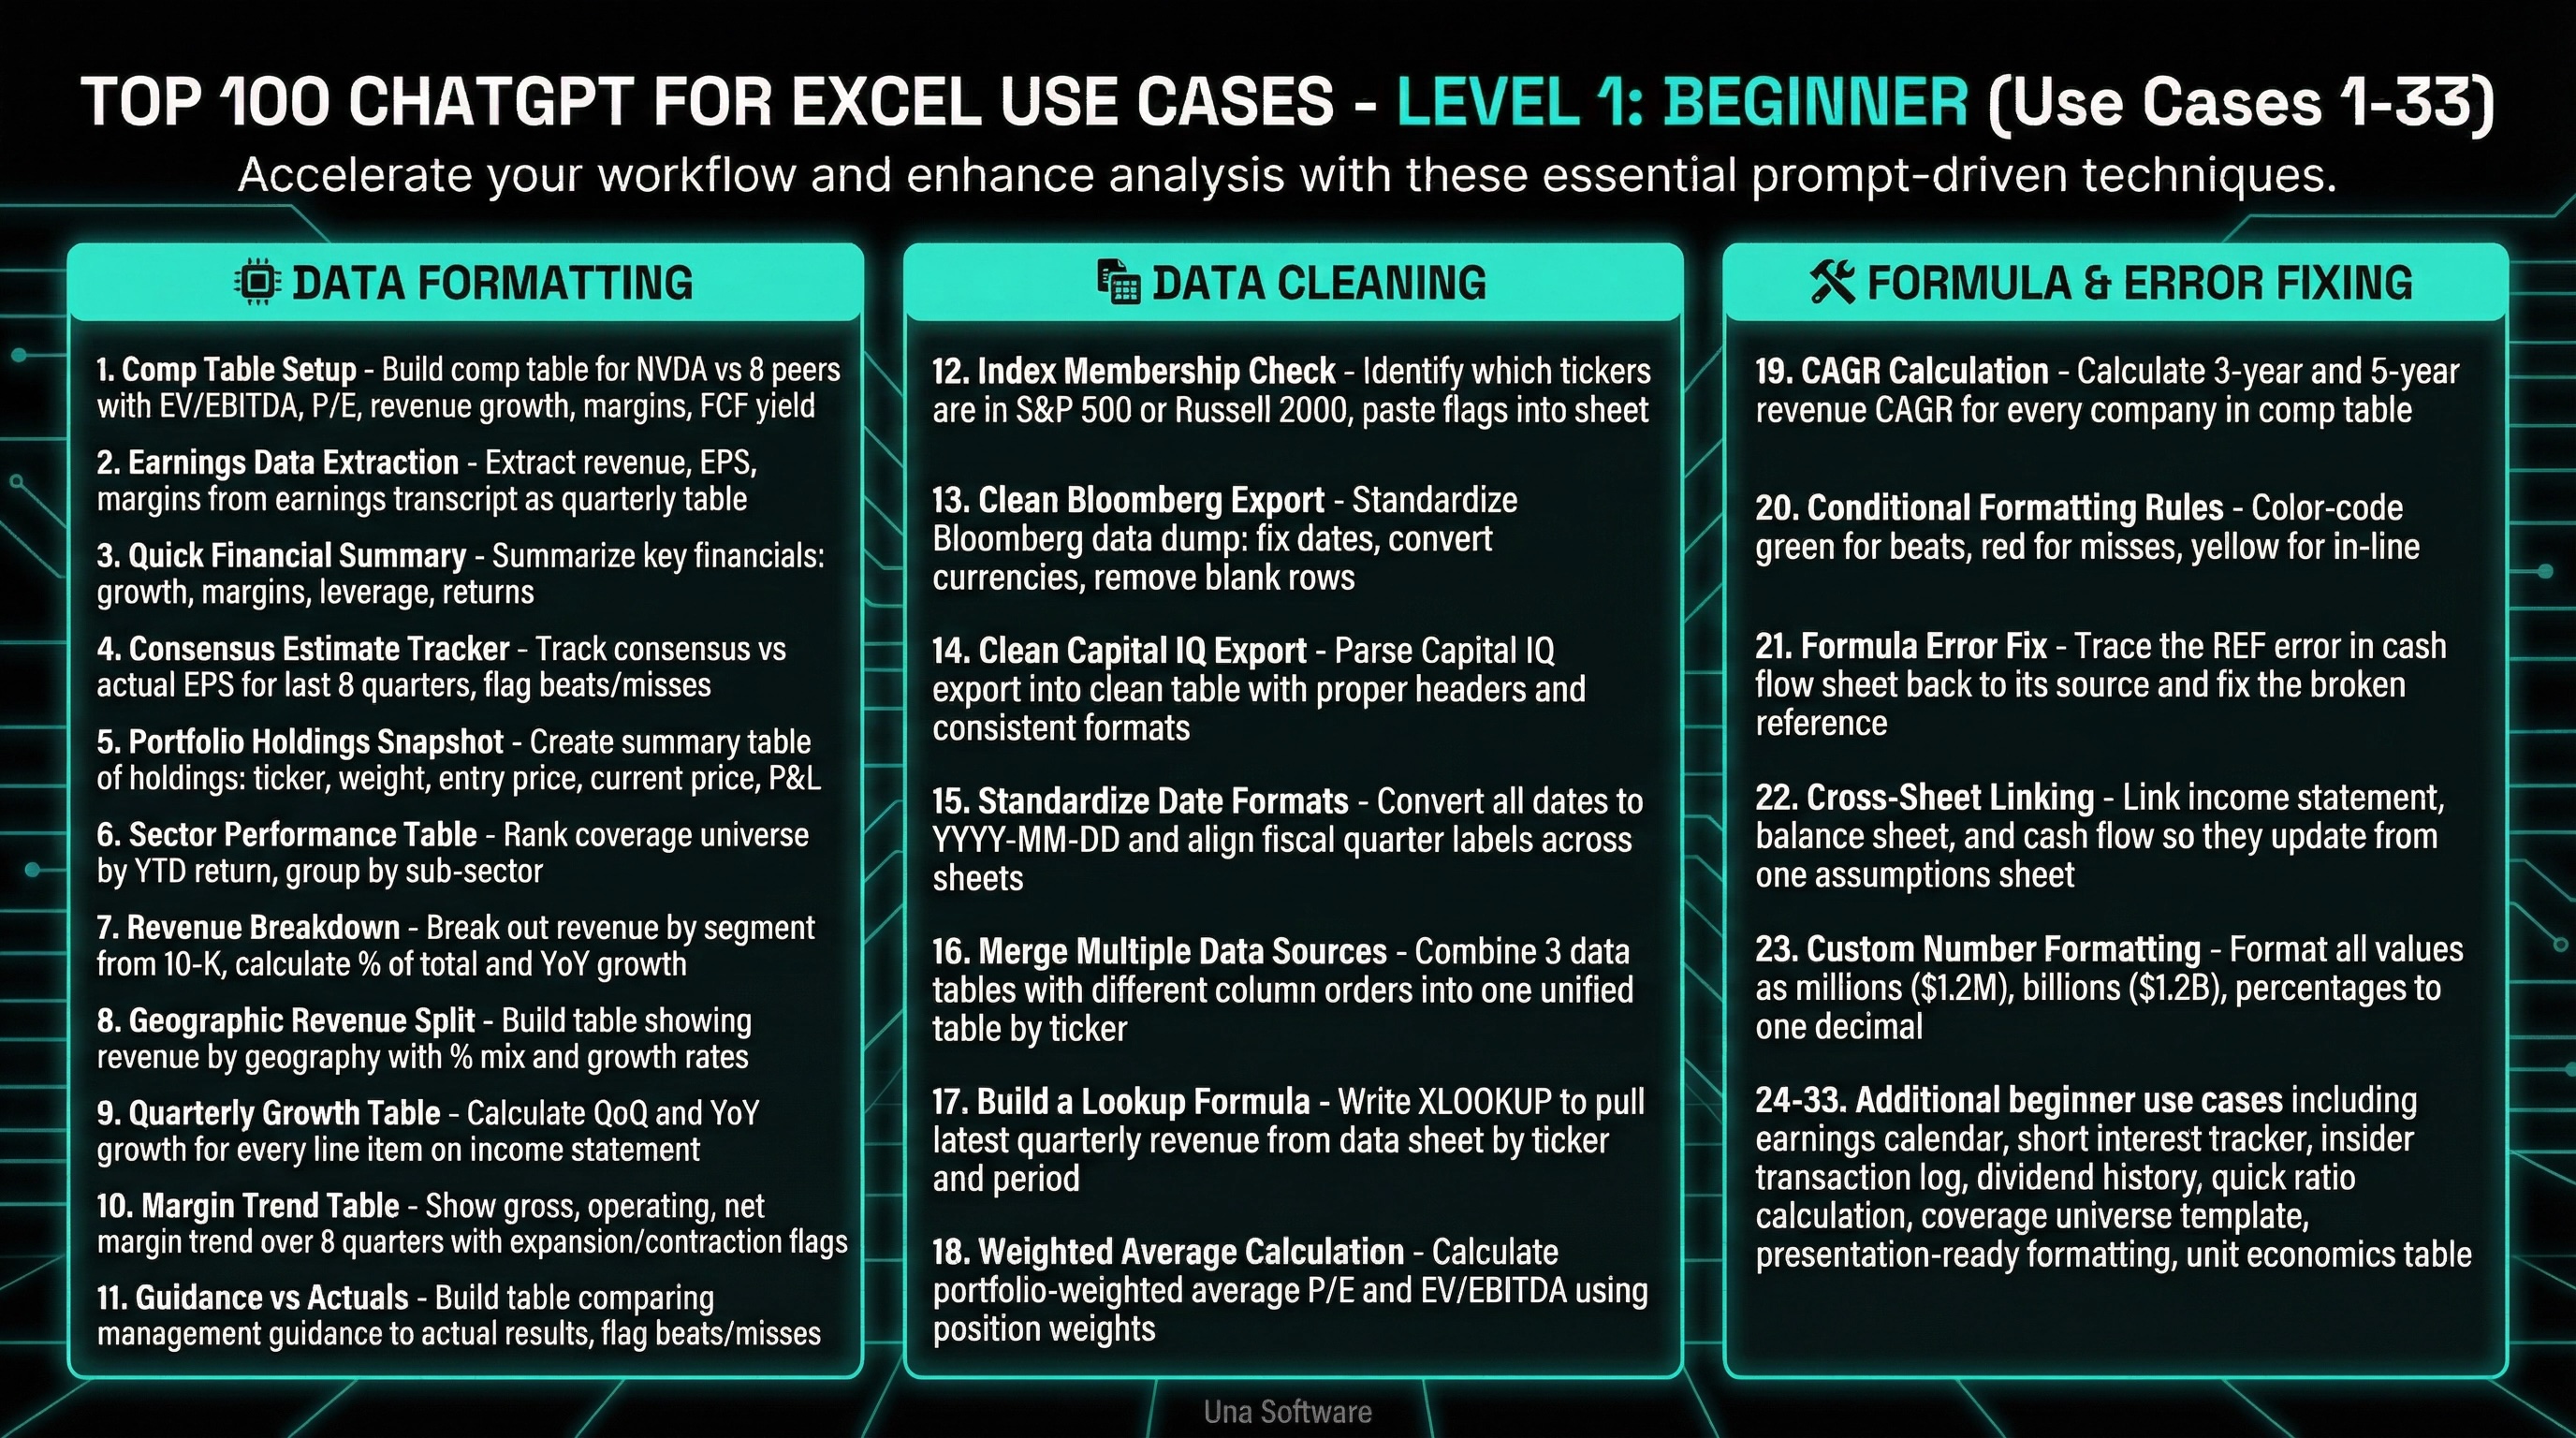
Level 1: The Beginner Basics (Use Cases 1-33)
This is where everyone starts, and unfortunately, where most people stop. Level 1 is focused on efficiency and syntax. It is about automating the tedious, low-value tasks that consume your morning.
Data Formatting & Summarization
1.Comp Table Setup: Build a comp table for NVDA vs. 8 peers with EV/EBITDA, P/E, revenue growth, margins, FCF yield.
2.Earnings Data Extraction: Extract revenue, EPS, and margins from this earnings transcript and format as a quarterly table.
3.Quick Financial Summary: Summarize this company's key financials from the data in my workbook: growth, margins, leverage, returns.
4.Consensus Estimate Tracker: From estimates I pasted, build a table tracking consensus vs. actual EPS for the last 8 quarters.
5.Portfolio Holdings Snapshot: Create a summary table of my holdings: ticker, weight, entry price, current price, P&L, days held.
6.Sector Performance Table: Rank my coverage universe by YTD return and group by sub-sector.
7.Revenue Breakdown: Break out revenue by segment from the 10-K data I pasted. Calculate % of total and YoY growth.
8.Geographic Revenue Split: Build a table showing revenue by geography with % mix and growth rates.
9.Quarterly Growth Table: Calculate QoQ and YoY growth for every line item on the income statement.
10.Margin Trend Table: Show gross, operating, and net margin trend over 8 quarters with expansion/contraction flags.
11.Guidance vs Actuals: Build a table comparing management guidance to actual results for the last 8 quarters. Flag beats/misses.
Data Cleaning & Standardization
12. Index Membership Check: Use ChatGPT to identify which of my tickers are in the S&P 500 or Russell 2000, paste flags into my sheet.
13. Clean Bloomberg Export: Standardize this Bloomberg data dump: fix dates, convert currencies, remove blank rows, align column headers.
14. Clean Capital IQ Export: Parse this Capital IQ export into a clean table with proper headers and consistent number formats.
15. Standardize Date Formats: Convert all dates to YYYY-MM-DD and align fiscal quarter labels across company sheets.
16. Merge Multiple Data Sources: Combine these 3 data tables (different column orders) into one unified table by ticker.
17. Build a Lookup Formula: Write an XLOOKUP to pull latest quarterly revenue from my data sheet by ticker and period.
18. Weighted Average Calculation: Calculate portfolio-weighted average P/E and EV/EBITDA using position weights in column C.
Formula Generation & Error Fixing
19. CAGR Calculation: Calculate 3-year and 5-year revenue CAGR for every company in my comp table.
20. Conditional Formatting Rules: Color-code green for beats, red for misses, yellow for in-line. Apply to the entire quarterly results table.
21. Formula Error Fix: Trace the #REF error in my cash flow sheet back to its source and fix the broken reference.
22. Cross-Sheet Linking: Link the income statement, balance sheet, and cash flow sheet so they update from one assumptions sheet.
23. Custom Number Formatting: Format all values: millions as $1.2M, billions as $1.2B, percentages to one decimal.
24. Earnings Calendar Table: Build an earnings calendar for my 30-stock coverage list for the next 4 weeks.
25. Short Interest Tracker: From short interest data I pasted, build a tracker: SI %, days to cover, borrow rate, with change flags.
26. Insider Transaction Log: Format this Form 4 data into a clean table: date, insider name, title, bought/sold, shares, price, value.
27. Dividend History Table: From dividend data I pasted, build a history table: ex-date, amount, yield, payout ratio, YoY growth.
28. Quick Ratio Calculation: Calculate current ratio, quick ratio, and net debt/EBITDA from the balance sheet data.
29. Coverage Universe Template: Set up a master coverage template: ticker, company name, sector, market cap, key metrics, last update date.
30. Presentation-Ready Formatting: Format this table for a slide deck: bold headers, alternating shading, borders, proper alignment.
31. Unit Economics Table: Calculate revenue per user: ARPU, CAC, LTV, and LTV/CAC from the data in my model.
32. Supply Chain Mapping: Build a table of key suppliers and customers for AAPL with estimated revenue dependency %.
33. Management Ownership Table: Build a table showing insider ownership: name, title, shares, % of outstanding, last transaction.
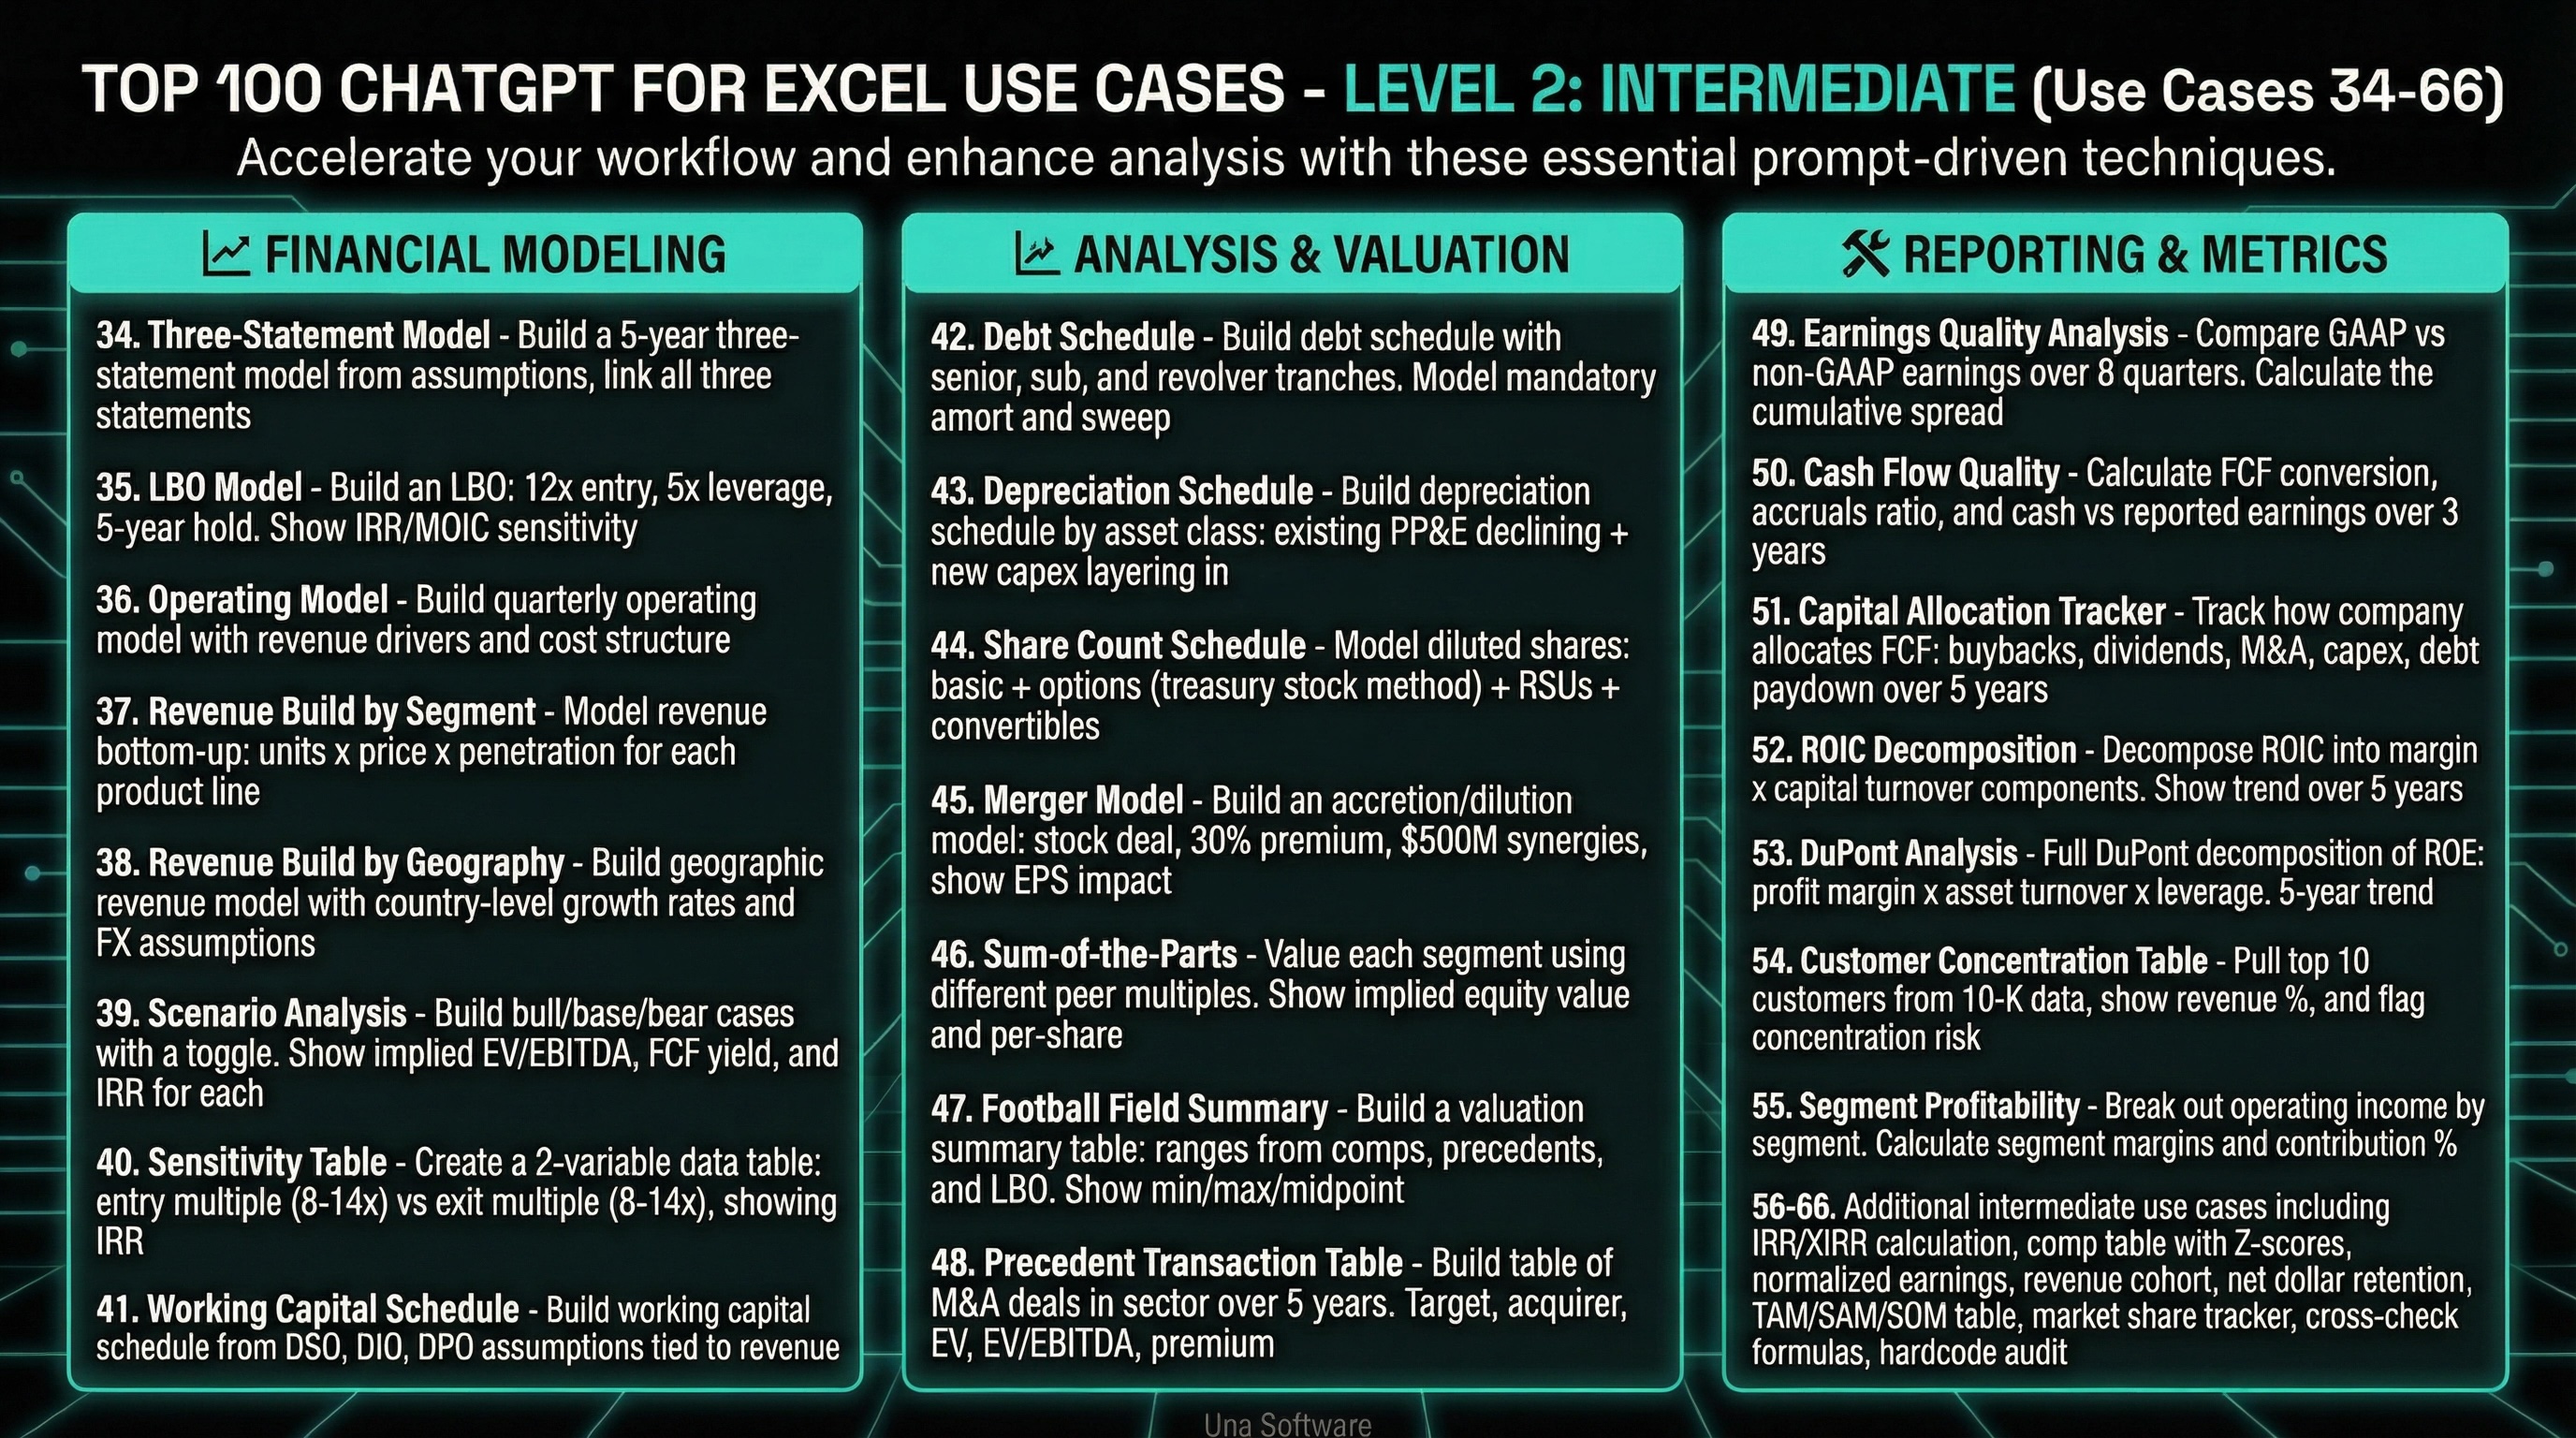
Level 2: The Intermediate Modeler (Use Cases 34-66)
Level 2 is where you transition from data manipulation to actual financial modeling and analysis. This is the realm of the FP&A professional who wants to build dynamic, scalable models without spending three days linking cells.
Financial Modeling
34. Three-Statement Model: Build a 5-year three-statement model from the assumptions I pasted. Link all three statements.
35. LBO Model: Build an LBO: 12x entry, 5x leverage, 5-year hold, cash flow sweep. Show IRR/MOIC sensitivity.
36. Operating Model: Build a quarterly operating model with revenue drivers and cost structure.
37. Revenue Build by Segment: Model revenue bottom-up: units x price x penetration for each product line.
38. Revenue Build by Geography: Build a geographic revenue model with country-level growth rates and FX assumptions.
39. Scenario Analysis: Build bull/base/bear cases with a toggle. Show implied EV/EBITDA, FCF yield, and IRR for each.
40. Sensitivity Table: Create a 2-variable data table: entry multiple (8-14x) vs. exit multiple (8-14x), showing IRR.
41. Working Capital Schedule: Build a working capital schedule from DSO, DIO, DPO assumptions tied to revenue.
Analysis & Valuation
42. Debt Schedule: Build a debt schedule with senior, sub, and revolver tranches. Model mandatory amort and sweep.
43. Depreciation Schedule: Build a depreciation schedule by asset class: existing PP&E declining + new capex layering in.
44. Share Count Schedule: Model diluted shares: basic + options (treasury stock method) + RSUs + convertibles.
45. Merger Model: Build an accretion/dilution model: stock deal, 30% premium, $500M synergies, show EPS impact.
46. Sum-of-the-Parts: Value each segment using different peer multiples. Show implied equity value and per-share.
47. Football Field Summary: Build a valuation summary table: ranges from comps, precedents, and LBO. Show min/max/midpoint.
48. Precedent Transaction Table: Build a table of M&A deals in [sector] over 5 years. Target, acquirer, EV, EV/EBITDA, premium.
Reporting & Metrics
49. Earnings Quality Analysis: Compare GAAP vs. non-GAAP earnings over 8 quarters. Calculate the cumulative spread.
50. Cash Flow Quality: Calculate FCF conversion, accruals ratio, and cash vs. reported earnings over 3 years.
51. Capital Allocation Tracker: Track how the company allocates FCF: buybacks, dividends, M&A, capex, debt paydown, 5 years.
52. ROIC Decomposition: Decompose ROIC into margin x capital turnover components. Show trend over 5 years.
53. DuPont Analysis: Full DuPont decomposition of ROE: profit margin x asset turnover x leverage. 5-year trend.
54. Customer Concentration Table: Pull top 10 customers from the 10-K data, show revenue %, and flag concentration risk.
55. Segment Profitability: Break out operating income by segment. Calculate segment margins and contribution %.
56. IRR/XIRR Calculation: Calculate IRR on these uneven cash flows with specific dates. Show sensitivity to exit timing.
57. Comp Table with Z-Scores: Add z-scores to my comp table so I can see which metrics are outliers for each company.
58. Normalized Earnings: Calculate mid-cycle normalized EBITDA by averaging through-cycle margins over 7 years.
59. Revenue Cohort: Build a cohort retention table showing revenue from each customer vintage over 5 years.
60. Net Dollar Retention: Calculate NDR and logo churn from the cohort data. Show trend and benchmark vs. peers.
61. TAM/SAM/SOM Table: Size the TAM top-down from industry data, then cut to SAM by geography and SOM by share.
62. Market Share Tracker: Build a market share table from competitor revenue data over 5 years. Show share gains/losses.
63. Cross-Check Formulas: Verify every formula in the model matches the pattern of its row. Flag deviations.
64. Hardcode Audit: Find every hardcoded number in the output sheets that should be a formula. List them all.
65. Model Sign Convention Fix: Check and fix sign conventions: positive for inflows, negative for outflows, consistent everywhere.
66. Assumption Documentation: Generate a table listing every assumption in the model, its cell reference, current value, and source.
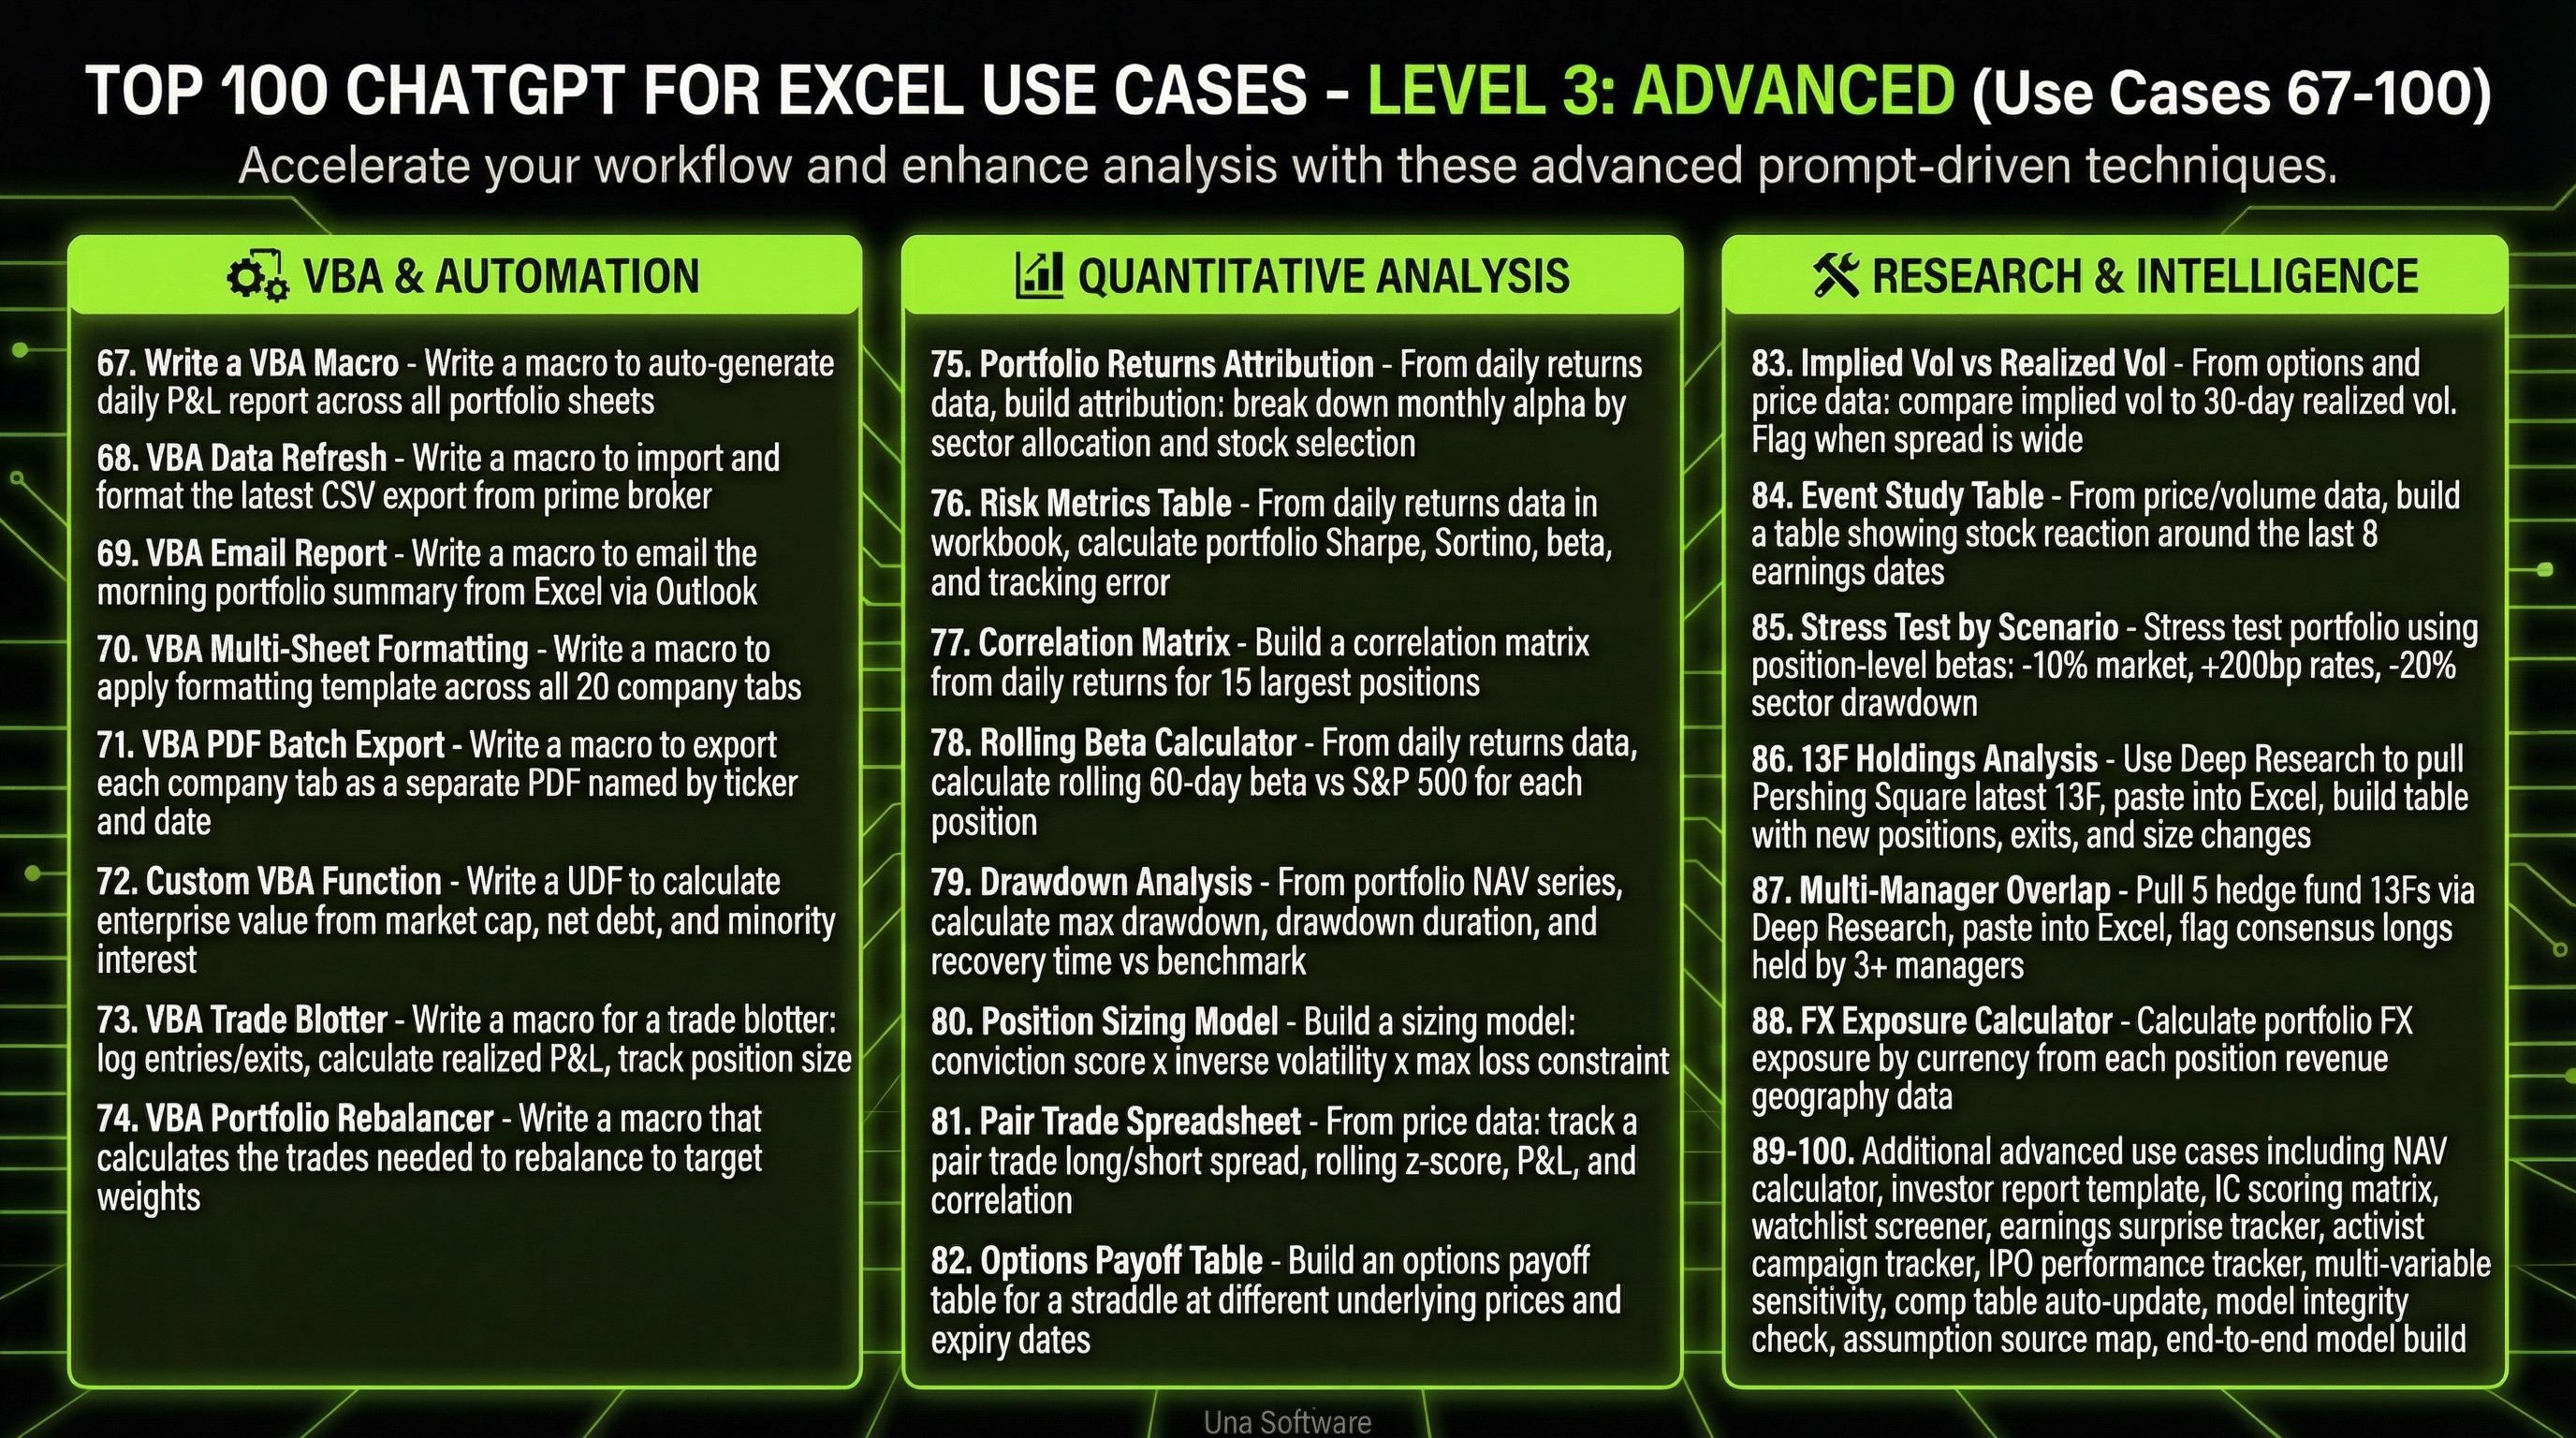
Level 3: The Advanced Architect (Use Cases 67-100)
Level 3 is the frontier. This is where Excel transcends its traditional boundaries and becomes a programmable, automated research platform. At this level, you are using natural language to write code, backtest strategies, and build institutional-grade financial architecture.
VBA & Automation
67. Write a VBA Macro: Write a macro to auto-generate my daily P&L report across all portfolio sheets.
68. VBA Data Refresh: Write a macro to import and format the latest CSV export from our prime broker.
69. VBA Email Report: Write a macro to email the morning portfolio summary from Excel via Outlook.
70. VBA Multi-Sheet Formatting: Write a macro to apply my formatting template across all 20 company tabs.
71. VBA PDF Batch Export: Write a macro to export each company tab as a separate PDF named by ticker and date.
72. Custom VBA Function: Write a UDF to calculate enterprise value from market cap, net debt, and minority interest.
73. VBA Trade Blotter: Write a macro for a trade blotter: log entries/exits, calculate realized P&L, track position size.
74. VBA Portfolio Rebalancer: Write a macro that calculates the trades needed to rebalance to target weights.
Quantitative Analysis
75. Portfolio Returns Attribution: From my daily returns data, build attribution: break down monthly alpha by sector allocation and stock selection.
76. Risk Metrics Table: From daily returns data in my workbook, calculate portfolio Sharpe, Sortino, beta, and tracking error.
77. Correlation Matrix: Build a correlation matrix from the daily returns I pasted for 15 largest positions.
78. Rolling Beta Calculator: From my daily returns data, calculate rolling 60-day beta vs. S&P 500 for each position.
79. Drawdown Analysis: From my portfolio NAV series, calculate max drawdown, drawdown duration, and recovery time vs. benchmark.
80. Position Sizing Model: Build a sizing model: conviction score x inverse volatility x max loss constraint.
81. Pair Trade Spreadsheet: From price data I pasted, track a pair trade long/short spread, rolling z-score, P&L, and correlation.
82. Options Payoff Table: Build an options payoff table for a straddle at different underlying prices and expiry dates.
Research & Intelligence
83. Implied Vol vs Realized Vol: From options and price data I pasted, compare implied vol to 30-day realized vol. Flag when spread is wide.
84. Event Study Table: From price/volume data, build a table showing stock reaction around the last 8 earnings dates.
85. Stress Test by Scenario: Stress test my portfolio using position-level betas: -10% market, +200bp rates, -20% sector drawdown.
86. 13F Holdings Analysis: Use Deep Research to pull Pershing Square's latest 13F, paste into Excel, build a table with new positions, exits, and size changes.
87. Multi-Manager Overlap: Pull 5 hedge fund 13Fs via Deep Research, paste into Excel, flag consensus longs held by 3+ managers.
88. FX Exposure Calculator: Calculate portfolio FX exposure by currency from each position's revenue geography data in my model.
89. NAV Calculator: Build a daily NAV calculator with management fee accrual and performance fee high-water mark.
90. Investor Report Template: Create a monthly investor report template: performance vs. benchmark, attribution, top/bottom contributors.
91. IC Scoring Matrix: Build an IC scoring sheet: score each idea on thesis quality, risk/reward, catalyst, and timing.
92. Watchlist Screener: Build a screener from my data: filter by growth >15%, margin >30%, EV/EBITDA <15x, FCF positive.
93. Earnings Surprise Tracker: From consensus + actual data I pasted, track earnings surprises: beat/miss magnitude, stock reaction day-of.
94. Activist Campaign Tracker: Use Deep Research to find 13D filings in my sector, paste into Excel, build tracker: fund, target, stake %, thesis.
95. IPO Performance Tracker: From IPO data I pasted, track: offer price, first-day return, 6-mo vs. offer, vs. index since listing.
96. Multi-Variable Sensitivity: 3-variable sensitivity: entry multiple x leverage x exit multiple, showing IRR.
97. Comp Table Auto-Update: When I paste new quarterly data, update all calculated fields in my comp table: growth rates, multiples, rankings.
98. Model Integrity Check: Full audit: check for circular refs, hardcodes in output cells, broken links, formula inconsistencies.
99. Assumption Source Map: Generate a map of every assumption in the model: cell, value, source (10-K, transcript, consensus).
100. End-to-End Model Build: Deep Research pulls assumptions from filings, paste into Excel, add-in builds the full model with linked formulas.
The Hidden Advantage of Moving to Level 3
When you reach Level 3, something interesting happens to your career trajectory. You stop being viewed as the person who produces the reports, and you start being viewed as the person who builds the systems. This is the exact skill profile that commands the highest salary premiums in modern finance.
By demonstrating that you can use natural language to generate complex VBA scripts and automate entire departmental workflows, you prove that you understand both the financial mechanics and the technological leverage required to scale a business. This is the definition of a hybrid finance professional.
Furthermore, mastering Level 3 prepares you for the inevitable transition to unified Performance Planning platforms. Tools like Una Software are built on the premise that data ingestion, modeling, and BI should all be connected and driven by AI. When you understand how to push Excel to its absolute limits using ChatGPT, you are perfectly positioned to lead the implementation of these next-generation platforms within your organization.
How to Move Up the Maturity Curve
The gap between the finance teams operating at Level 1 and those operating at Level 3 is massive, and it is compounding every single quarter.
If your FP&A team is still manually reconciling spreadsheets and writing basic formulas, you are competing against teams that have automated their entire reporting infrastructure and are using AI to run complex scenario analyses in seconds.
The transition does not happen overnight. You cannot jump straight to building custom VBA macros if your team does not understand how to properly prompt the AI for basic data extraction.
Start by mastering the Level 1 fundamentals. Get your team comfortable with using ChatGPT to format data, extract insights, and troubleshoot errors. Do not let them stop there. Once that muscle memory is established, force the progression to Level 2.
Require your analysts to use AI to assist in building three-statement models and running sensitivity analyses. Make dynamic scenario modeling the baseline expectation for every presentation. Finally, identify your most technical team members and empower them to explore Level 3. Give them the mandate to use natural language to write macros and build advanced quantitative models.
The tools are already sitting on your desktop. The add-ins are available in the marketplace. The only thing standing between your current workflow and a Level 3 AI-powered finance function is the willingness to push past the basic use cases and explore what is truly possible.
Excel is no longer just a spreadsheet. It is time to start treating it like the intelligent platform it has become. If you want to see how modern teams are integrating these advanced capabilities into a unified Performance Planning architecture, explore platforms like Una Software that are built natively for this new paradigm. The future of finance belongs to the architects, not the data entry clerks.
If you think these 100 use cases for ChatGPT + Excel are interesting wait until you see what Una.Ai can deliver for enterprise grade AI powered FP&A and Performance Planning. Check out more guides and playbooks at Una.AI


